An advanced performance optimisation guide for Looker Studio should be the cornerstone of every serious dashboard builder’s toolkit. As dashboards grow (more data, more charts, more users) the risk of sluggish load times, time-outs, and frustrated stakeholders increases. A slow dashboard is almost as bad as an incorrect one: people stop trusting it.
In this post I’ll walk you through advanced techniques to speed up, stabilise, and “future-proof” your Looker Studio dashboards. I’ll show you how to balance performance and functionality, when to pre-process data, and how to design for scale. All using the Superstore Products dataset as a concrete example.
Why performance matters (and what slows dashboards down)
Before we dive into fixes, let’s understand what typically kills performance:
- Very large underlying datasets (hundreds of thousands to millions of rows)
- Many charts or widgets on a single page
- Complex calculations, data blending or heavy filters recalculated on load
- Live connectors fetching data on every load rather than using cached or extracted snapshots
A sluggish dashboard frustrates users, and leads to dashboards being ignored. That is why performance optimisation isn’t optional. It’s essential.
1. Pre-aggregate and pre-process data – avoid heavy lifting in Looker Studio
One of the most effective strategies is to push heavy processing out of Looker Studio.
For example, with the Superstore Products dataset: rather than loading every single order row, consider building a master summary table outside Looker Studio (in your data warehouse or source system) that contains aggregated metrics by Category, Subcategory, Region, or Date.
This way:
- Looker Studio only needs to visualise pre-aggregated data (much lighter to load)
- You avoid complex calculations inside the dashboard (which slow down load times)
- You make your dashboard easier to maintain and more predictable
If you’re using a database or data warehouse (e.g. BigQuery), build such summarised tables or materialised views there, then connect to them rather than raw tables.
2. Use extracted data sources or static snapshots when real-time is not essential
If your data does not need real-time updates, using an extracted data source is often the fastest option. Looker Studio’s Extract Data connector lets you capture a snapshot of your data, which the report uses instead of querying the live source every time.
Then you can schedule the extraction to run daily (or hourly, depending on your needs). This dramatically reduces load time and also cuts down on API calls or database costs.
⚠️ Keep in mind the data freshness requirements of your stakeholders. If daily snapshots are enough, this is one of the best performance wins you can make.

3. Limit the number of widgets per page — or split heavy dashboards across pages
Every chart, table or widget you add to a page can trigger a separate data request. If you have too many, the load time increases, sometimes non-linearly.
Better approach: distribute content across multiple pages, each with a manageable number of widgets. For example, a page for summary KPIs, a page for category breakdowns, a page for regional view, etc.
This also improves user experience: pages load faster, and users can navigate logically without waiting.
With Superstore Products, you might have one page with top-level revenue & profit KPIs, another for category/subcategory breakdowns, another for region & shipping analysis, and a final one for detailed tables or drill-downs.
4. Reduce use of calculated fields, filters and heavy blending inside Looker Studio
Every calculated field, filter, blend or custom transformation adds processing overhead. When you rely heavily on these inside Looker Studio, performance suffers.
Where possible:
- Perform calculations outside Looker Studio (in your data warehouse or at ETL stage)
- Keep the number of filters and complex segments to a minimum
- Avoid blending multiple large datasets at the dashboard layer. Again, pre-blend upstream when possible
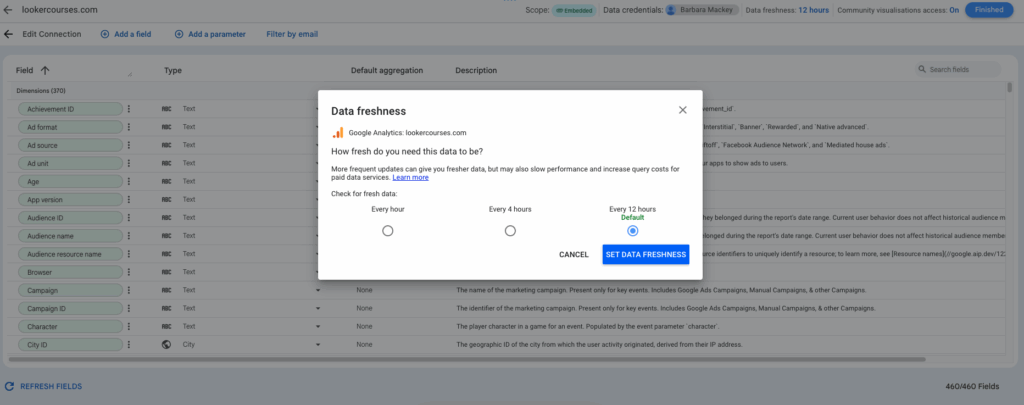
5. Manage data freshness and caching smartly
Many dashboards do not need real-time data. Constantly refreshing huge datasets can kill performance. Looker Studio includes settings for data freshness, use them.
For example, if you’re using Superstore Products sales data for weekly or monthly reports, a once-a-day or once-every-few-hours data refresh is usually enough. This allows Looker Studio to serve cached data for most views, keeping dashboards snappy.
6. Choose efficient visualisations, avoid overly heavy charts
Some chart types are more “expensive” than others, especially those returning many data points, or pivot tables with many rows & columns.
When working with large datasets:
- Prefer summary charts (e.g. aggregated bar charts, scorecards, simple time series) rather than giant pivot tables
- Don’t load every row just for export; if detailed table needed, put it on a separate page
- If you use pivot tables or tables with many rows/columns, try to limit them to avoid browser memory issues
7. Combine smart data architecture with user-friendly design
Performance optimisation is technical, but it must go hand in hand with user experience. A fast dashboard that nobody understands is still useless.
Use the dataset fields and chart types that make sense. For Superstore Products, you might pre-aggregate by Category / Subcategory / Region, and then visualise revenue, profit margin or order counts with straightforward bar charts, treemaps or scorecards.
When dashboards load fast and are easy to interpret, stakeholders actually use them. When they drag, they get ignored.
Final thoughts – Advanced performance optimisation guide for Looker Studio
Building a powerful dashboard is not just about beautiful visuals. It’s about performance, reliability, and long-term usability. An advanced performance optimisation guide like this helps you design dashboards that scale, stay responsive, and continue to deliver insights even as data volume grows.
Whenever you build a new Looker Studio dashboard, remember:
- Clean and pre-aggregate data upstream
- Use extracts or snapshots when real-time is unnecessary
- Keep each page lean, limited widgets and efficient charts
- Minimise on-the-fly calculations and blending
- Use caching and sensible data refresh settings
If you follow these principles, even with a dataset as rich as Superstore Products, you’ll build dashboards that are fast, stable and trusted. And that’s not just technical. It’s the kind of quality that stakeholders recognise, use, and rely on.
FAQs – Advanced performance optimisation guide for Looker Studio
-
Why does my Looker Studio dashboard load slowly even with few charts?
Usually because the data behind those charts is large (many rows), there are heavy calculations or blends, or the data connector is live and non-cached. Pre-aggregation and data extraction often solve this.
-
What is the Extract Data connector and when should I use it?
The Extract Data connector creates a static snapshot of your data for Looker Studio to query instead of hitting the live source every time. Use it when you don’t need real-time data, it improves load times significantly.
-
How many widgets per page is too many?
There is no hard limit, but as a rule of thumb, try to keep pages under ~10–15 widgets (charts/tables) and avoid 20+ widgets triggering many simultaneous data queries. If you exceed that, split into multiple pages.
-
Should I do all calculations outside Looker Studio?
If possible, yes. Pre-process or pre-aggregate data before it reaches Looker Studio. This reduces processing overhead, speeds up dashboards, and reduces risk of error at runtime.
-
Does caching data reduce data freshness?
Yes. There is a trade-off: caching improves performance but may mean data is not real-time. Choose a data freshness schedule that balances performance with timeliness of your reporting.