
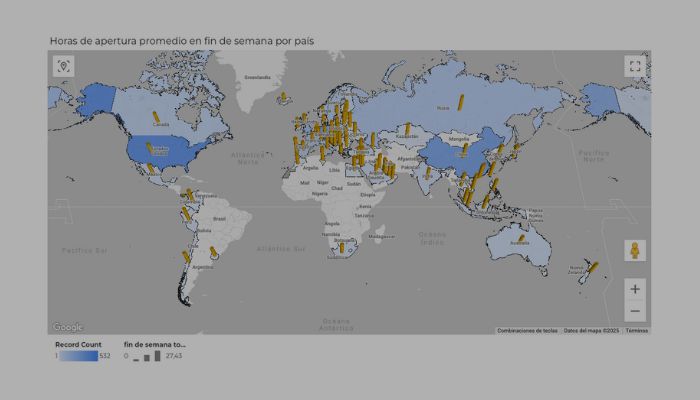
A combo map in Looker Studio is a layered Google Maps chart that combines a filled‑area map with a bubble map. The filled layer colours geographic regions (such as countries or cities) while the bubble layer overlays metrics like store counts or total opening hours. This makes it ideal for visualising geospatial data with regional shading and point‑level metrics.
Why use a combo map in Looker Studio?
I always recommend combo maps when you want to display two levels of geography or metrics:
- A filled layer (for example, countries or continents highlighting region)
- A bubble layer at store‑level showing metrics (e.g. weekend opening hours per store)
Using both together helps viewers intuitively understand regional context and precise store information.
Step by step: create a combo map in Looker Studio using H&M stores dataset
Here’s how you build a combo map in Looker Studio, with my step‑by‑step style:
Step 1: Connect your data
- Make a copy of the H&M stores dataset in Google Sheets so you get edit rights of the new document
- Connect the data to you Looker Studio report.
Step 2: Add a combo map chart
- In the report Editor, click Add a chart → choose Google Maps → select Combo map
- Click on the canvas to insert the combo map

Step 3: Configure the Location and layers
- Under Setup, choose a Location dimension: use something like Country.
- For the Additional Layer Metric, choose Weekend total opening hours and change the metric’s aggregation to the average, so bubble size reflects how long the store is open on weekends.
Step 4: Add a Colour dimension or metric (filled layer)
- Use Continent as the Colour dimension to shade regions differently. That gives you a filled layer.
- Alternatively, you can use the metric Record count under Colour metric, to colour the different countries based on how many stores they have
- Please note that you can’t use a colour dimension and a colour metric at the same time. Once you use one, the other disappears from Setup.

Step 5: Style the combo map in Looker Studio
- Under Style, enable Use vector graphics and turn on Show in 3D view so bubbles appear as columns.
- Pick a map type (Map or Satellite with labels).

Tips & best practices
- Title your chart clearly, e.g. H&M stores weekend hours combo map.
- Add a legend and adjust bubble size scaling for clarity. The scaling is done in Style, under Additional layer.
- Use Colour dimension rather than metric dimension if categories (country, continent) provide better clarity.
- Limit number of data points (< 5,000) to keep map performance smoot.
- Make sure Tooltip values are unique to prevent errors (unique values for same location).

Combo map in Looker Studio FAQs
-
What is a combo map in Looker Studio vs a bubble or filled map?
A combo map combines a filled map (shaded regions) with a bubble map (point metrics), while bubble maps show only points and filled maps only shading. The combo gives both layers.
-
Can I use latitude and longitude explicitly?
Yes. Use latitude + longitude as the Location dimension if full addresses are inconsistent. That ensures accurate geocoding.
-
How many data points can a combo map show?
Generally up to a few thousand. Too many may slow performance.
-
Can I enable 3D tilt effect?
Yes, under Style enable Show in 3D view so bubbles appear as vertical columns giving better depth perception.
Summary
Your combo map is a powerful Looker Studio visual combining filled country shading with point‑level metrics like weekend opening hours for H&M stores. By carefully configuring Location, Colour dimension, Additional Layer Metric, and style settings, you get a chart that’s both insightful and visually attractive.
Stay tuned for more tutorials and feel free to ask for extra examples or refinement.


