
Have you ever wanted to explore what-if scenarios in your dashboard, like “What if traffic increases by 15% next quarter?” or “What would revenue look like with a 25% growth in orders?” With parameters, you can create fully interactive custom forecasting models in Looker Studio that give users the power to experiment and project outcomes based on growth assumptions.
In this post, I’ll show you how to implement custom forecasting models in Looker Studio using the Superstore Products dataset. It’s a great way to add interactivity to your reports, especially for business cases, marketing simulations, or ecommerce planning.
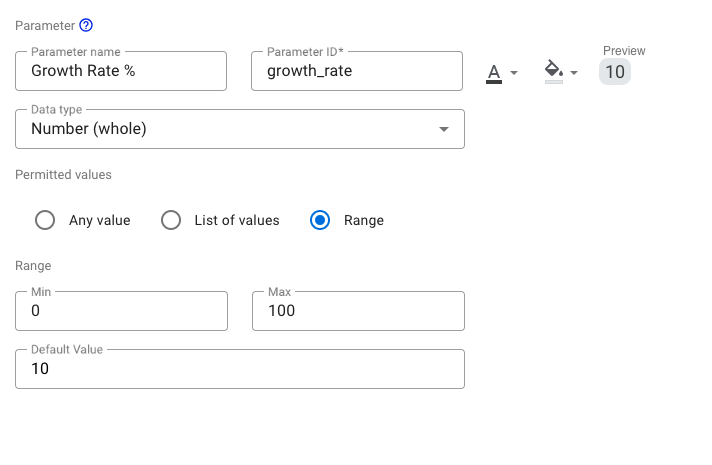
🔧 Step 1: Create a growth rate parameter
To implement custom forecasting models in Looker Studio, let’s start by adding a parameter that allows users to define a percentage growth rate.
- Go to Resource > Manage added data sources > Edit your data source
- Click on Add a Parameter
- Name it:
Growth Rate % - Set the Data type to
Number - Set Minimum value to
0, Maximum to100 - Set Default value to
10(or whatever you prefer) - Click Save
This parameter will represent the percentage increase (e.g. 10 for 10%).
🧮 Step 2: Build the Forecast Calculation
Let’s say we want to forecast Gross revenue based on a growth scenario. We’ll apply the selected percentage to the current value.
- Go to Resource > Manage added data sources > Edit your data source
- Click Add a Field > Add calculated field
- Name it:
Forecasted Revenue - Use this formula:
Gross revenue * (1 + Growth Rate % / 100)This creates a dynamic field where the value increases depending on the growth rate selected by the user.
📊 Step 3: Visualise custom forecasting models in Looker Studio
Now let’s put that forecast into a chart. You can:
- Create a time series chart with the metric
Gross revenue - Add
Forecasted Revenueas a second metric - Title the chart something like “Projected Gross Revenue”
This allows for an easy side-by-side comparison between actual and projected values.
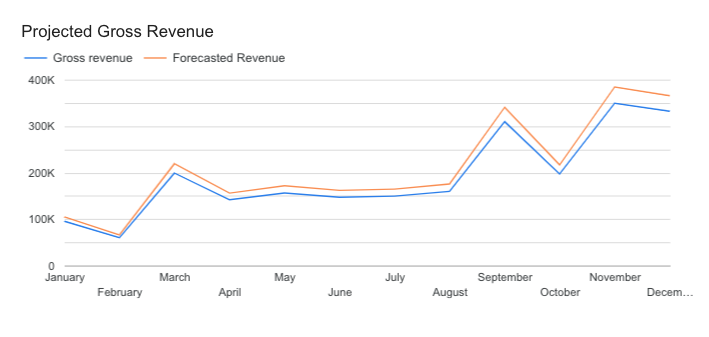
💡 Optional: Use different colours or add a line chart with both metrics for visual contrast.
🎛️ Step 4: Add a slider control
Now it’s time to give your users control over the growth rate so we can see custom forecasting models in Looker Studio in action.
- Click Add a Control > Slider
- Set the control field to
Growth Rate % - Adjust the min/max range if needed (e.g. 0 to 100)
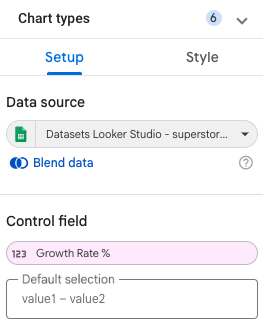
This allows viewers to explore different growth scenarios by sliding between values without editing or guesswork required.
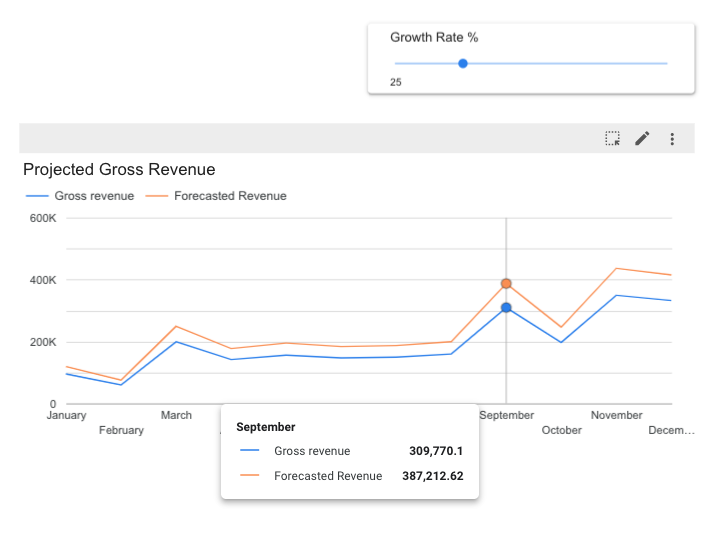
💼 Use case example: Revenue projections
Using the Superstore Products dataset:
- Suppose current
Gross revenuein September is £309,770. - A user selects a 25% growth rate via the slider.
- The
Forecasted Revenuewill now show £387,212.
This technique works beautifully for:
- Traffic growth simulations
- Campaign impact estimations
- Upselling or product expansion scenarios
- Budget or ROI forecasting
✨ Final touches
To make your forecasting model even more powerful:
- Add a comparison table showing:
- Current revenue
- Forecasted revenue
- Difference (
Forecasted Revenue - Gross revenue)
- Use conditional formatting to highlight large growth impacts
- Add explanatory text or tooltips to guide your users
✅ Final thoughts
Custom forecasting models in Looker Studio let you transform static dashboards into smart, interactive tools. With a simple growth rate parameter and a bit of maths, you can simulate future revenue, traffic, or sales in a way that feels intuitive and useful for decision-makers.
Once you set this up, you can expand it to other metrics like Quantity, or Net revenue, depending on your dataset and analysis goals.
❓FAQs
-
Can I apply this to other metrics?
Yes! You can use the same logic to forecast anything numerical, like
Total price, number of transactions, or site sessions if you’re using GA4. -
Can I allow negative values for shrink scenarios?
Absolutely. Just set the minimum value of the parameter to a negative number (e.g. -50) and users can model declines as well.
-
What’s the difference between a forecast model and trendline?
Trendlines show statistical projections based on past data. Custom forecasting models let users define their own assumptions, making them perfect for goal-setting and planning.
-
Does this work in tables, scorecards, and charts?
Yes, use the
Forecasted Revenuefield in any chart. The parameterised forecast will automatically adjust based on user input.