If you’re looking to make your reports more interactive, personalised, and easier to understand, combining parameters in Looker Studio with dynamic text is an excellent place to start. These two features allow your dashboards to react to user input, providing instant context and clarity for your audience.
Let’s explore how I use parameters in Looker Studio and dynamic text together to transform static reports into flexible, user-driven experiences.
What is dynamic text?
Dynamic text refers to any text element in your Looker Studio report that automatically updates based on filters, date selections, or user input via parameters. It could be as simple as a title that reflects a selected date range, or a sentence that includes the user’s custom sales target.
In short, dynamic text makes your report feel more alive, and far more useful.
Step 1: Create a parameters in Looker Studio
To make dynamic text truly interactive, I first set up a parameter. Parameters are user-defined variables (like a target sales value or a percentage increase) that users can input directly in the report.
Here’s how I do it:
- Go to your Resource → Manage added data sources in Looker Studio
- Click Edit on your data source
- Click Add a Parameter
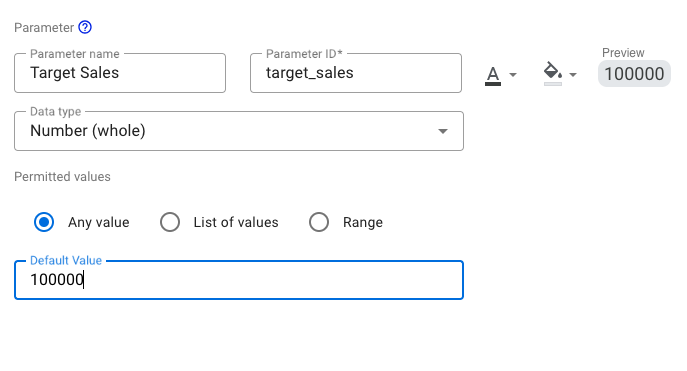
- Set it up with:
- Name: e.g.
Target Sales - Data type: Number, Whole Number, Text (depending on what you need)
- Default value: e.g.
100000 - Permitted values or range (optional): Define limits or dropdown choices for more control
- Name: e.g.
Parameters appear with a purple icon in your field list and can be used throughout your report.
Step 2: Add a control for user input
To allow your audience to interact with the parameter:
- Click Add a Control
- Choose the Input Box, for typing in numbers or text
- Bind the control to the parameter
Now your users can input or adjust values directly on the report page, and everything linked to the parameter will update in real time.
Read User-added targets in your Looker Studio report using parameters to see an example.
Step 3: Use parameters in Looker Studio calculations
One of the most common use cases for parameters is scenario modelling or variance calculation. For example:
Sales Difference = Total Sales - Target Sales
Or, if I’m projecting a revenue increase based on a user-defined percentage, I might use:
Projected Revenue = Revenue * (1 + Growth Percentage / 100)
Users can change the value in the control and see how their new input affects the calculations instantly.
Step 4: Display dynamic text
Now comes the fun part, bringing all this to life visually.
There are two main ways I display dynamic text:
1. Using scorecards or tables as text boxes (the classic workaround)
Before dynamic text was officially supported, I used scorecards or tables with calculated fields and styled them to look like text boxes. That involved:
- Removing headers
- Making the background transparent
- Adjusting fonts and alignment
This still works and can be useful for quick metric displays based on parameter inputs.
2. Using the “@” symbol for seamless dynamic text (the modern way)
Thanks to a recent update, we can now type @ directly inside any text box to insert dynamic fields or parameter values. These are called query result variables or chips.
You can now write things like:
“As of @Current Date, the total sales are @Total Sales.”
Or:
“Your target is set to @Target Sales. Actual sales are @Total Sales.”
This makes the report feel more conversational, intuitive, and responsive to the viewer’s choices.
Best practices I follow
To ensure my reports are clear and user-friendly, I stick to these principles:
- Clarity: Label inputs and dynamic fields so users always know what they’re seeing or changing
- Consistency: Keep formatting and style consistent for all dynamic elements
- Validation: Where possible, use permitted ranges or lists to prevent invalid or extreme inputs
Even small touches, like tooltips or short instructions, can really improve the user experience.
-
What are parameters in Looker Studio?
Parameters in Looker Studio are user-defined variables that allow viewers to input values (like a sales target or growth rate) directly in a report, making dashboards more interactive and personalised.
-
How do I create parameters in Looker Studio?
Go to Resource → Manage added data sources → Edit → Add a Parameter. From there, set the name, data type (number, text, percentage), default value, and optional permitted range.
-
How do parameters work with dynamic text in Looker Studio?
Parameters can be inserted into text boxes using the @ symbol. For example: “Your target is @Target Sales. Actual sales are @Total Sales.” This makes text automatically update based on user input.
-
What’s the difference between chart filters and parameters in Looker Studio?
Filters restrict the data being shown, while parameters let users input values that can be used in calculations, comparisons, or dynamic text, adding a new layer of interactivity.
Final thoughts
Parameters in Looker Studio and dynamic text are two of the most powerful tools in Looker Studio for building truly interactive reports. They allow users to input their own targets or variables, and immediately see how those inputs affect the data; all while the text and calculations update seamlessly.
Whether you’re guiding users through a sales dashboard, financial projection, or campaign analysis, this combo gives you the flexibility to build dashboards that respond in real time and feel tailored to the individual viewer.
Give it a try, and make your next report feel less like a snapshot, and more like a conversation.