

If you work with dashboards regularly, you already know that segmentation is where most of the insight happens. Metrics on their own rarely tell a story. It’s the ability to organise them into meaningful categories that helps business stakeholders understand performance quickly. This is exactly where Looker Studio bins and groups become incredibly useful.
For many years, segmentation in Looker Studio meant one thing: long CASE WHEN expressions. You would define ranges, create buckets or cluster values by hand. The approach works, but it is slow, error-prone, and difficult to maintain. Beginners often find themselves copying and pasting formulas just to change a single threshold.
Looker Studio bins and groups change this dynamic. They introduce a visual way to cluster values, no formulas required. Once you understand how and when to use them, you will find yourself building cleaner, more scalable dashboards much faster.
In this guide, I’ll show you how to use both features correctly, how to avoid the mistakes I see most often, and how to apply them using one of my favourite teaching datasets: Spotify 2023.
What are Looker Studio bins and groups?
The distinction is simple:
- Bins split numeric fields into ranges (for example, 0–5M streams).
- Groups merge text values into categories (for example, genre clusters).
This means you don’t need to write a single CASE WHEN for basic segmentations. Looker Studio does the heavy lifting for you in a visual editor, and you can update the rules at any time.
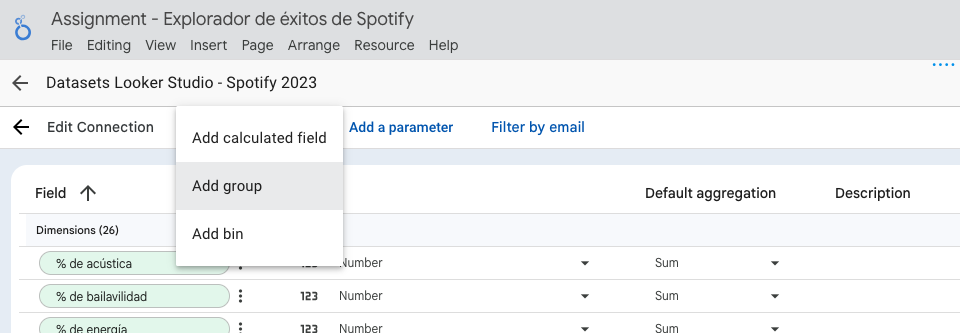
Both features live inside Add field (Resource → Manage added data sources → Edit (data source).
Using Looker Studio Bins with the Spotify 2023 dataset
Bins are designed for continuous numeric fields. They’re ideal for things like:
- Revenue tiers
- Age ranges
- Popularity levels
- Order value bands
- Track streams ranges
- Shipping cost brackets
In the Spotify 2023 dataset, streams is a perfect candidate. Instead of scanning through thousands of individual values, we convert those values into popularity buckets.
Example: Create streaming popularity ranges
Imagine you want to divide tracks into three intuitive levels.
Open your report and:
- Go to Resource → Manage added data sources → Edit (data source)
- Select Add field.
- Choose Add bin.
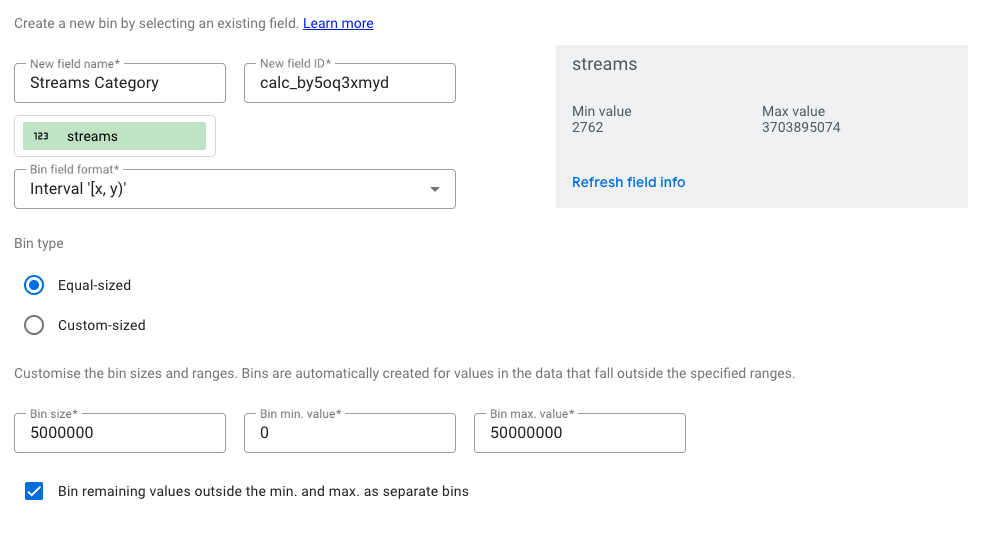
- Select the numeric field: streams.
- Name your new field, for example:
Streams Category. - Choose a bin strategy:
- Equal sized (Looker Studio creates equal chunks)
- Custom sized (you define specific breakpoints)
- Enter your rules. For example:
- Minimum: 0
- Maximum: 50000000
- Bin size: 5000000
- Enable “Bin remaining values outside the min. and max. as separate bins” for anything above 50M.
- Save.
Looker Studio will automatically generate categories such as:
- 0–5M
- 5M–10M
- 10M–15M
- … up to the threshold
Drop Streams Category into a table and combine it with a metric such as streams. You will instantly see popularity brackets instead of a long column of raw numbers.
This is one of the simplest improvements you can make to a dashboard. Stakeholders intuitively understand “5–10M streams” far more than “7,894,221 streams”.
Limitations of Looker Studio bins
Bins are powerful but they come with constraints:
- They work only on numeric dimensions
- They cannot be applied to text values.
- They are less suitable for non-linear segmentation (for example, 0–1M, 1–20M, 20–30M).
If your groups represent business logic rather than mathematical thresholds, you may still prefer a custom calculated field.
Using Looker Studio groups with the Spotify 2023 dataset
Groups are Looker Studio’s categorical segmentation tool. They allow you to consolidate labels into larger, more meaningful categories.
This is incredibly useful when you have:
- Many similar subcategories
- Slight naming variations
- Messy labels imported from external systems
- Genre or content types
- Product variations that belong to the same family
Example: Create genre clusters
Let’s create broad genre segments using the artist(s)_name to see the collaborations done by Taylor Swift, Ed Sheeran or Shakira with other artists.
Open your report:
- Select Add field.
- Choose Add group.
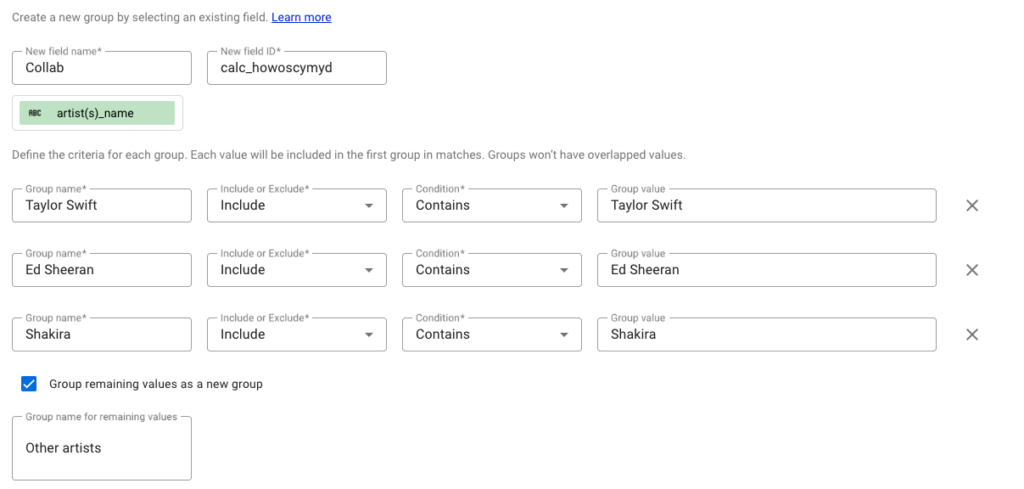
- Pick the text field you want to group. For example, artist(s) name.
- Name your field:
Collabs. - Add your groupings and conditions
- Optionally create a final group called Other to capture remaining values.
- Save.
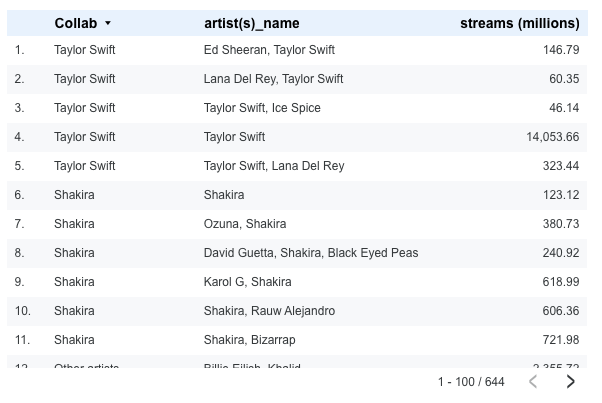
Drag Collabs into a table with the dimension artist(s)_name and a metric such as streams.
Benefits of Looker Studio Bins and Groups
One of the best aspects of these features is not what they do technically, but what they do emotionally for your workflow. They remove friction.
- You write fewer CASE formulas.
- Your dashboards become easier for clients to understand.
- You spend less time debugging small mistakes.
- Junior team members can segment data confidently.
- You accelerate production work and onboarding.
- You can refactor a dashboard without rewriting everything.
Once you adopt Looker Studio bins and groups, you begin to structure datasets in a far more intentional way.
FAQs – Looker Studio bins and groups
Bins segment numeric values into ranges. Groups combine text values into categories.
Yes. Groups let you merge any text values, even if they are inconsistent, messy or branded differently.
Yes. Use Custom sized binning to define exact thresholds.
Sometimes. When segmentation rules are layered or dynamic, CASE is still best. But for most scenarios, Bins and Groups are faster and easier to maintain.
Final thoughts
Looker Studio bins and groups are two of the most impactful features added in recent years. They remove the need to script every category manually, and they allow you to model the data in a way that people actually understand.


