
Combo map in Looker Studio: how to create one with H&M store data
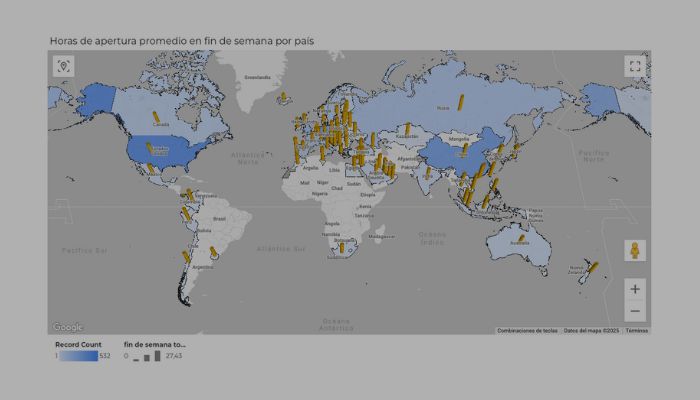
A combo map in Looker Studio is a layered Google Maps chart that combines a filled‑area map with a bubble […]
A combo map in Looker Studio is a layered Google Maps chart that combines a filled‑area map with a bubble […]

One of the most visually appealing ways to represent data in Looker Studio is through maps. In this post, we’ll

If you’ve been following my series on maps in Looker Studio, today we’re diving into another powerful visualisation: the Looker

Continuing with the posts on maps in Looker Studio, let’s look at another one offered by Google Maps: the filled

Google Maps brought Looker Studio’s map visualisations to a more advanced level. There are several types available, and in this