
Funnel chart in Looker Studio provides a powerful visualisation to map user journeys and conversion drop‑offs in sequential stages, from product views through to purchases. Released in September 2024 as a native chart type, it’s ideal for ecommerce analytics using GA4 data like the Google Merchandise Store.
In this guide, I’ll walk you through how to build and style a funnel chart in Looker Studio using the GA4 demo account.
🔍 What is the funnel chart in Looker Studio?
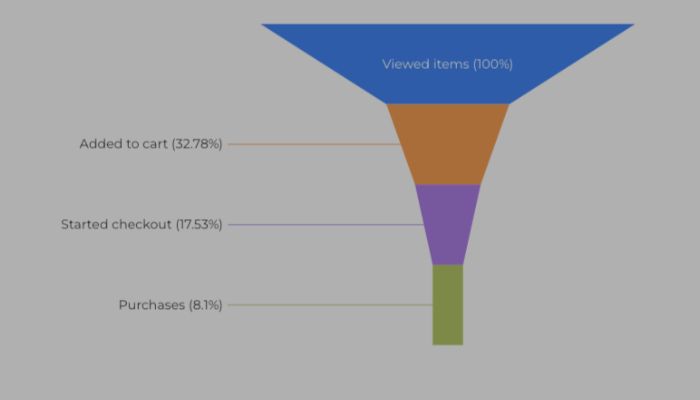
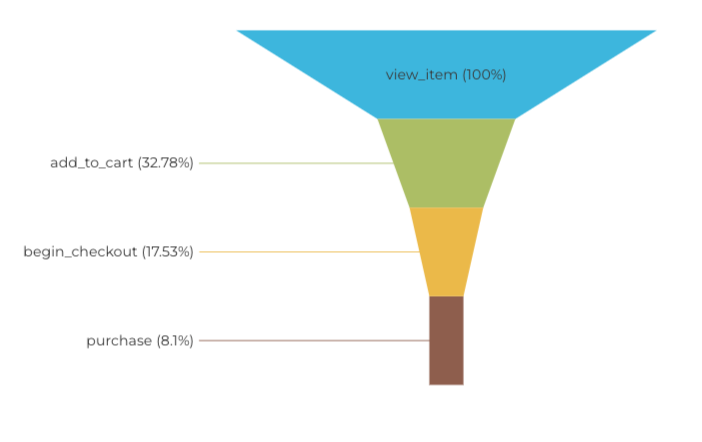
A funnel chart in Looker Studio allows you to visualise how a metric changes across ordered stages, such as view_item, add_to_cart, begin_checkout, and purchase. The first stage should typically be the largest, tapering down as users drop off along the journey. You can display this as smoothed bar, stepped bar, or inverted triangle styles.
📁 Step 1: Connect the GA4 Google Merchandise Store data
- Create a new Looker Studio report.
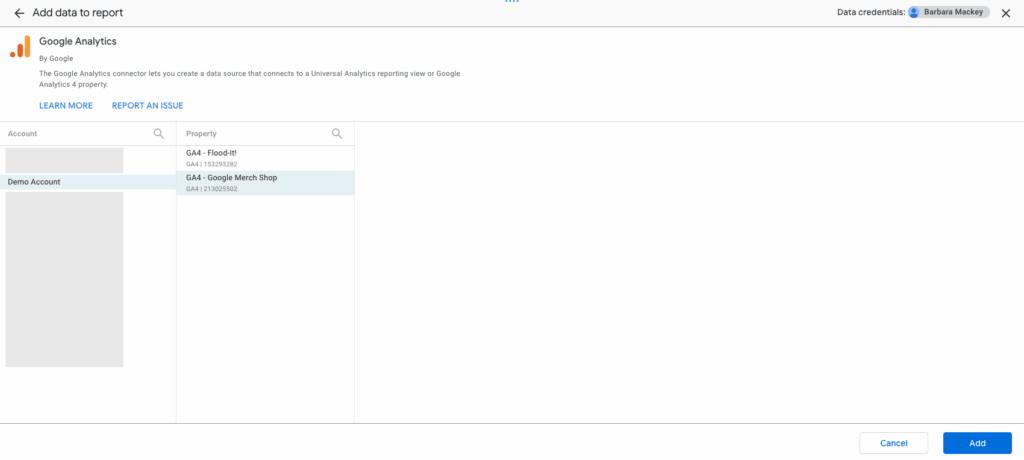
- Add the data source: choose Google Analytics → GA4 → Google Merchandise Store demo property.
📊 Step 2: Add the funnel chart
- In the toolbar, click Add a chart → Funnel chart.

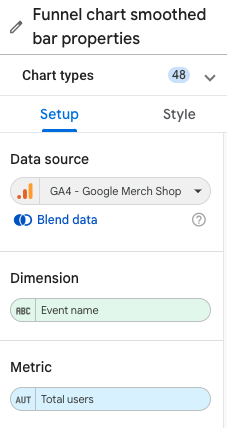
- In the right-hand Setup panel, select:
- Dimension:
Event name - Metric:
Total users
- Dimension:
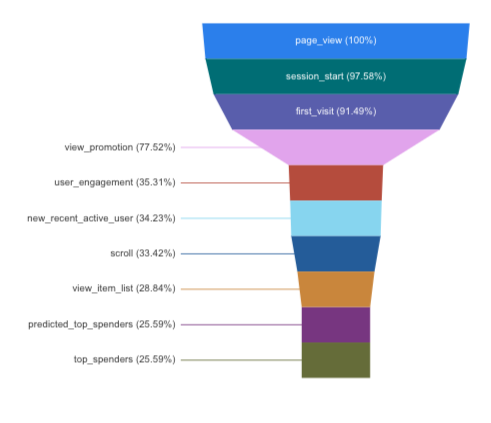
- By default, Looker Studio creates a funnel of all event names, but next we’ll filter for the ecommerce steps you care about.
🧹 Step 3: Apply a filter for key eCommerce events
To focus the funnel on relevant steps:
- In the Setup panel, click Add a Filter → Create a filter.
- Use a Regular Expression match for the events:
view_item|add_to_cart|begin_checkout|purchase - Apply the filter. This limits the funnel to only those four stages.
🏷️ Step 4: Make event names user‑friendly
Raw event names like view_item are fine, but cleaner labels help viewers:
- Go to Resource → Manage added data sources → Edit your GA4 data source.
- Click Add a Field and create
Better event name:CASE WHEN Event name = 'view_item' THEN "Viewed items" WHEN Event name = 'add_to_cart' THEN "Added to cart" WHEN Event name = 'begin_checkout' THEN "Started checkout" WHEN Event name = 'purchase' THEN "Purchases" END - Return to the funnel chart and replace the dimension with
Betterevent name

🌈 Step 5: Choose a funnel style
Looker Studio offers three funnel styles:
- Smoothed bar: smooth taper between steps
- Stepped bar: clear drop-off per stage
- Inverted triangle: classic funnel shape
Choose the one that suits your dashboard best. Check out this post to see how to change the chart type in Looker Studio in 3 clicks.
📉 Step 6: Show data labels as percentage and/or numbers
You have different options to choose from for the data labels.
- In the Style tab, locate Data label.
- Choose to show data labels as:
- Percentage
- Number
- Number + Percentage
- Select the percentage type:
- vs max percentage
- vs previous step
🛠️ Step 7: Use scorecards for additional context
Many users overlook funnel tooltips. To make raw stage counts instantly visible:
- Insert Scorecard charts for each key event:
Viewed items,Added to cart, etc. - Use filters on each scorecard to isolate events:
- e.g. include only
Event name = view_itemwith metricTotal users
- e.g. include only
Place these above or beside the funnel chart for quick reference.
🎯 Why use the funnel chart in Looker Studio?
- Highlight where engagement or conversion declines sharply.
- Combine with filters (e.g. by country, device, or campaign) for deeper insight.
- Provide actionable insights quickly for ecommerce dashboards.
❓Funnel chart in Looker Studio FAQs
-
Is the funnel chart native to Looker Studio?
Yes, it became available in September 2024 under visualisation options. No need to use community components unless you need more custom control.
-
Can I sort stages manually?
You can sort by dimension alphabetically or metric. If the default ordering doesn’t match your logical funnel, use computed labels like
1. Viewed items,2. Added to cartand sort ascending. -
Can I show both counts and percentages?
Yes, select Number + Percentage under Data label in the Style options.
-
Is this applicable to any ecommerce site?
Absolutely. If you can map event metrics from GA4 (view_item, add_to_cart, begin_checkout, purchase), you can replicate this funnel in your own ecommerce data.
✅ Final Thoughts
The funnel chart in Looker Studio is a versatile and intuitive way to visualise sequential drop‑off in an ecommerce journey, perfect for the Google Merchandise Store GA4 demo or your own online store data. With a few clicks, filters, and pretty labels, you get a clear view of where users leave your funnel, and where you can improve.


