
Modern charts in Looker Studio have arrived, and they’re more than just a design refresh. This update gives you advanced styling controls, refined defaults, and enhanced chart logic that make dashboards cleaner, smarter, and more user‑friendly.
In this post, I’ll take you step by step through modern charts in Looker Studio: what these new visuals offer, how to enable them, and how to adapt your current reports without losing quality.
🔍 What are modern charts in Looker Studio?
Modern charts is an upgraded visualization engine that Google fully launched in early 2025. It enables:
- Rounded edges in bar and column charts
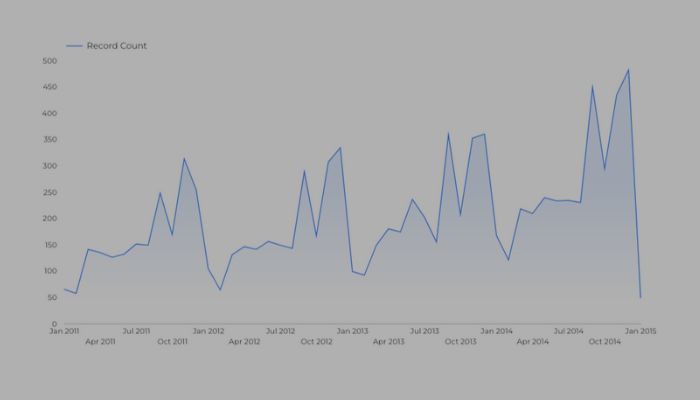
- Gradient line fills in line and time series charts
- Transparency control for scatter and bubble charts
- Enhanced padding for pie and donut charts
- Granular axis and gridline styling settings
- New default colour themes and styling presets
These enhancements provide tighter visual control and cleaner defaults for more readable dashboards.
🚀 How to enable modern charts in Looker Studio
Modern charts are enabled by default in new reports. For existing reports:
- Open the report in Edit mode
- Click Theme and layout in the toolbar or File menu
- Locate the Modern charts section
- Click Enable and confirm (note: this cannot be reversed)

Important tip: duplicate reports before enabling, so you have a fallback if any issues arise during the upgrade.
🎨 What modern charts change (by chart type)
Bar & Column Charts
- Rounded edges for a polished look
- Improved label styling, axis settings, and independent X/Y axis control
- Rotate, colour‑code, or hide axis elements more flexibly
Line & Time Series Charts
- Optional gradient fills
- Independent axis styling and gridline visibility
- Greater control over trendline display, colours, and label formatting
Scatter & Bubble Charts
- New opacity/transparency controls to improve readability of overlapping data points
- Axis customisation options similar to line charts
Pie & Donut Charts
- Padding between segments
- Rounded corners for a softer visual
- Retains core limitations of pie charts, but looks much cleaner
Tables & Pivot Tables
- Header border radius now respects overall table styling
- Multi‑column sorting now supported in tables
💡 Why you should use modern charts in Looker Studio
✅ Cleaner, more professional design as default styling
With modern charts in Looker Studio, your charts already look nicer without you having to do much. For example, bars have rounded edges, colours are more balanced, and spacing between elements is more consistent. It’s like getting a polished design straight out of the box, no fiddling with settings required.
✅ Stronger axis/gridline control for accessible dashboards
Modern charts give you more control over how your axes and gridlines look. You can show or hide them, adjust the spacing, and change their colours or thickness. This helps you make charts easier to read, especially for people who need clear visual guides to understand the data.
✅ Better aesthetics and readability, especially with overlapping visuals
Charts that have a lot of data (like scatter plots or bubble charts) can get messy when points overlap. Modern charts help fix this by letting you control transparency and spacing, so the visuals don’t feel cluttered. This makes it easier to spot trends and outliers at a glance.
✅ Future-ready: New features and improvements will build on this new chart engine
Modern charts are built on a new chart engine, which means future updates and improvements will happen here, not in the old version. If you want access to new features (like animations, more customisation, or better performance), modern charts are the way to go. They’re the foundation for where Looker Studio is heading next.
🎨 Prefer the old look? Use Classic themes instead
While you can’t turn modern charts off once they’re enabled in a report, you can still give your dashboards that familiar “classic” Looker Studio look by using a Classic theme. These themes bring back the original colour palettes and contrast levels, great if you’re updating an older report or want a more traditional style.
How to apply a Classic theme:
- Open your report in Edit mode
- Click Theme and layout in the toolbar, or use File → Theme and layout
- In the list of themes, choose one that says (Classic) in the name
These Classic themes work with modern charts but use colour schemes that match the older chart styling, helping your dashboards feel more familiar while still taking advantage of the new chart engine.
❓Modern charts in Looker Studio FAQs
-
Can I revert back to classic charts?
No, once modern charts are enabled, you can’t revert. That’s why copying the report is essential.
-
Will all charts be upgraded?
Most chart types are supported, but some remain unchanged. The visual theme still applies broadly.
-
Are community visualisations affected?
No, third-party charts remain independent but may fall back to default styles if they don’t support modern settings.
-
Does this affect performance?
Generally no. The new rendering is more efficient, though very complex or highly customised dashboards may need review after upgrade.
✅ Final Thoughts
Modern charts in Looker Studio usher in a smarter, sleeker era for dashboard design. With enhanced control over styling, axis configuration, labeling, and colour themes, you gain a clarity and polish that’s hard to achieve with classic charts.
For a more consistent, flexible, and attractive dashboard experience (especially for clients or executives) modern charts are well worth enabling. Just remember: test carefully, keep a classic backup, and apply thoughtful tweaks during the upgrade.


