Looker Studio Conversational Analytics is one of the easiest way to explore your data. For years, dashboards and visualisations in Looker Studio have been powerful but sometimes intimidating, especially for non-technical users. What if instead of writing formulas or building charts, you could just ask your data a question in plain English and get an instant answer?
That’s exactly what Looker Studio Conversational Analytics does. Powered by Gemini, Google’s AI model, this new feature brings a natural language interface to your data. You can explore metrics, build charts, and surface insights just by typing questions. No technical skills, SQL queries, or formulas required.
In this guide, we’ll walk through how Conversational Analytics works, how to use it step by step, and where it shines (and still struggles). We’ll use the Superstore Products dataset as our example, so you can see it in action on real business data.
Step 1: Enable Conversational Analytics and choose a data source
To start using Looker Studio Conversational Analytics, you first need to enable Gemini. Once enabled, a new option called Conversational Analytics appears in the left-hand menu of Looker Studio.
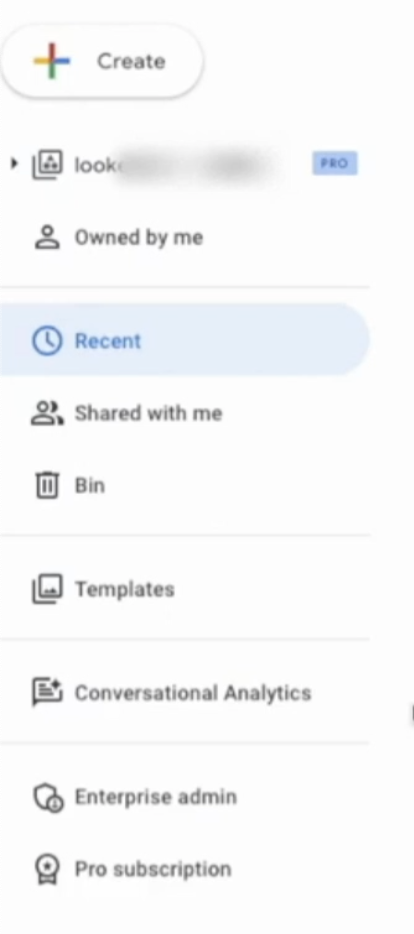
Clicking this option opens a dedicated workspace where you’ll be prompted to choose a data source. You can either connect a new one or pick an existing source. At the time of writing, Conversational Analytics supports the following data sources:
- Looker
- BigQuery
- Google Sheets
- CSV files
For this tutorial, we’ll use the Superstore Products dataset, a fictional retail dataset that includes fields like Order Date, Category, Profit, Net revenue, and Region.

Step 2: Ask your first questio
Once the data source is connected, you’ll see a text box where you can type a question — or choose one of Gemini’s suggested prompts.
For example, try typing:
“What is the average profit per order by category?”
Within seconds, Conversational Analytics will return a chart showing the average profit for each category (like Furniture, Technology, and Office Supplies).
Below the visualisation, you’ll also see a text explanation of how Gemini arrived at the answer. It might say something like:
- Selected the
Profitfield from Superstore. - Grouped results by
Category. - Calculated the average profit per order.
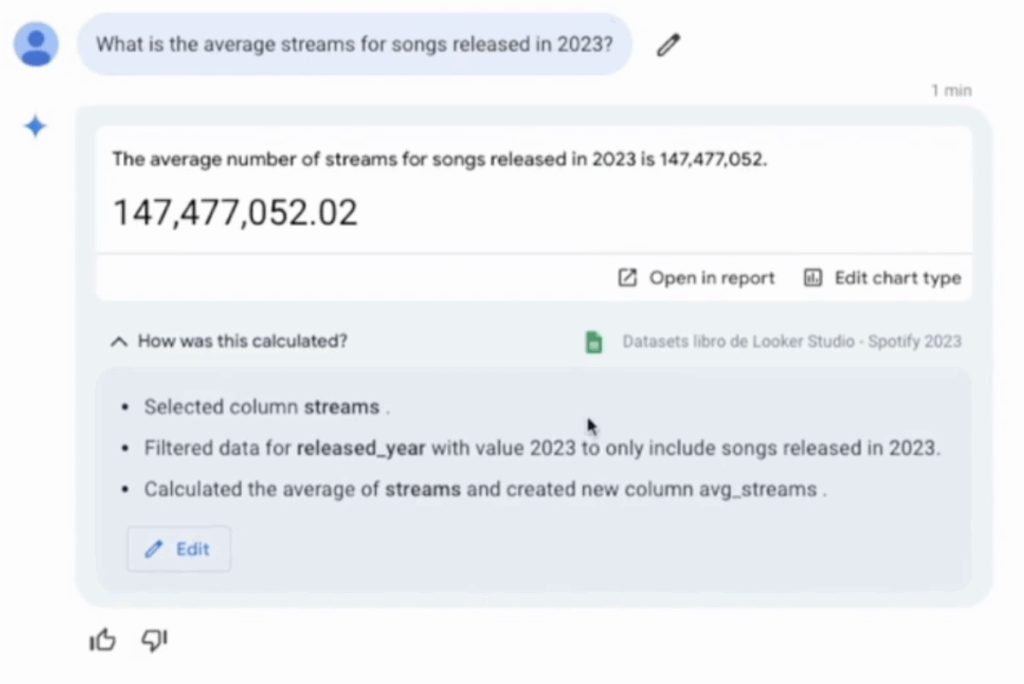
This level of transparency is helpful for validating results and learning how queries are interpreted.
Step 3: Refine your question for better insights
One of the most powerful aspects of Looker Studio Conversational Analytics is how easily you can refine your questions.
For example, you could follow up with:
“Show only categories with an average profit above £50.”
The AI will automatically filter the results based on your new criteria. Or you could make the question more specific:
“What was the average profit by category in 2023?”
Gemini will apply the time filter and return the updated results, without you having to build a single filter or calculated field.
Step 4: Explore advanced queries
Conversational Analytics can handle more than just simple aggregations. You can ask questions like:
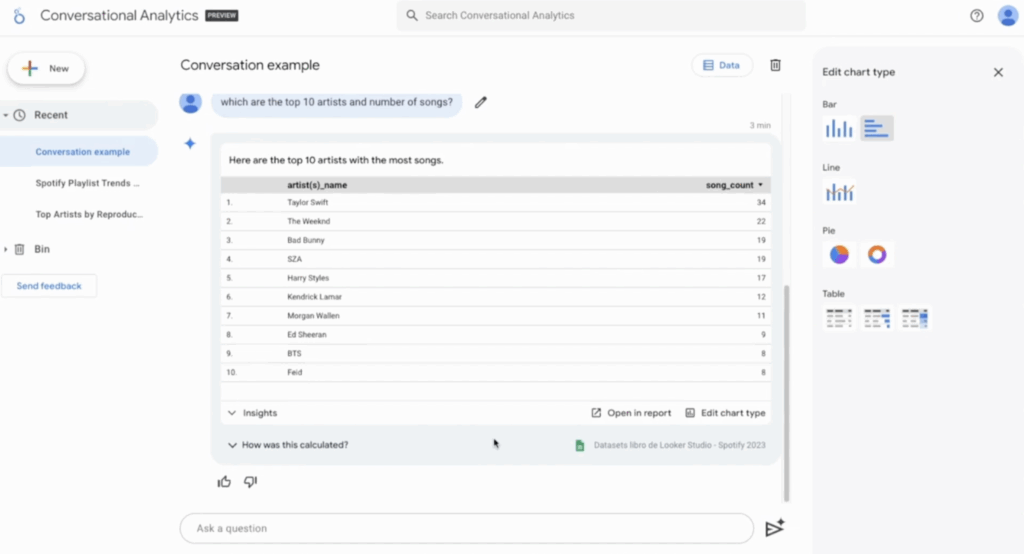
- “What are the top 10 products by total revenue?”
- “How many orders were placed in the East region last quarter?”
- “Show me the total revenue trend by month.”
It will respond with appropriate charts (from bar charts and time series to tables) and you can switch visual types by clicking Edit chart type at the bottom of the screen.
💡 Tip: If a result contains too many categories or data points, you can refine the question to limit the scope. For example:
“Show the top 5 regions by total profit.”
Step 5: Understand its limitations
While Looker Studio Conversational Analytics is a huge leap forward, it’s important to understand what it can’t do (yet). Currently, Gemini is best at answering questions that can be visualised with a single chart. It handles questions like:
- Trends of metrics over time
- Metric breakdowns by dimension
- Unique values of a field
- Top-N queries
However, there are still limitations:
- 📉 Period-over-period comparisons: “What is the percentage change in profit compared to last year?” is not yet supported.
- 🔮 Predictions and forecasting: AI can only answer to more advanced questions, such as forecasting, can be answered when the Code Interpreter is enabled.
- 📊 Advanced statistics: Correlation, regression, or anomaly detection are beyond its current capabilities.
For example, if you ask:
“What is the correlation between profit and discount?”
Gemini will return the average of each metric but won’t provide a correlation coefficient or scatter plot analysis.
Step 6: Turn your results into reports
Once you’re happy with an insight, you can click Open in report. Looker Studio will generate a fully editable report with the chart and data you created through natural language. Ready for you to customise and share.
This seamless workflow means that even non-technical team members can go from question to report-ready visual in minutes.
Best practices for Looker Studio Conversational Analytics
- ✍️ Be specific: The more precise your question, the more relevant the answer.
- 🔄 Iterate: Treat it like a conversation, refine questions step by step.
- 🧠 Check logic: Always review the “How this was calculated” explanation to validate results.
- 📊 Limit scope: If a query is too broad, break it into smaller questions.
- 🚀 Use it for exploration: It’s ideal for quick insights, hypothesis testing, and stakeholder demos.
FAQs: Looker Studio Conversational Analytics
-
Q: Can I use Conversational Analytics with any data source?
Not yet. Currently, it supports Looker, BigQuery, Google Sheets, and CSVs.
-
Q: Can I export results to a report?
Yes, once you’re satisfied with a result, click Open in report to generate a visual directly in Looker Studio.
-
Q: Does Conversational Analytics support complex queries like correlation or forecasts?
It’s designed for simple, single-visualisation queries such as aggregations, breakdowns, and top-N analyses. Although more advanced questions, such as forecasting, can be answered when the Code Interpreter is enabled.
-
Q: Can I edit the results returned by Gemini?
Yes, you can modify both the question and the query logic behind the result before exporting it.
Final thoughts – Looker Studio Conversational Analytics
Looker Studio Conversational Analytics is one of the most transformative features released in recent years. It removes barriers to data exploration, allowing anyone (not just analysts) to ask questions and get insights in plain language.
While it still has limitations with advanced analysis, its ability to turn questions into visualisations is a major step towards democratising data. Whether you’re a business user exploring KPIs or an analyst looking for a faster way to prototype insights, conversational analytics will change how you work with data in Looker Studio. 🚀