

July 2025 releases in Looker Studio bring three powerful new features to enhance report design, interactivity, and accessibility: new report canvas sizes, highlight charts by filter, and the ability to add descriptions to reports. In this post, I’ll walk you step by step through each update and explain how you can put them to work immediately.
🧩 What are the July 2025 releases in Looker Studio?
Google’s Looker Studio release notes on July 2025 include:
- Two new preset report canvas size options: A4 portrait and A4 landscape, letting you control report width and height more precisely.
- An Applied filters panel in view mode that easily allows to identify which charts are affected by filters.
- The ability to add descriptions to reports: a structured field where you can explain the report’s context, purpose or key questions addressed.
Here’s how to enable and use them effectively in your dashboards.
🖼️ New report canvas sizes
Why it matters
Until now, reports adopted fixed presets like US Letter or Screen aspect ratios. The addition of A4 canvas sizes means you can create dashboards designed for printing or embedding in documents with exact A4 dimensions.
How to use them
- Open your report in Edit mode
- Go to Theme & layout > Layout > Canvas size (or File > Theme & layout)
- Choose A4 – Portrait or A4 – Landscape from the preset list (alongside existing options like US‑Letter and Screen 16:9)

Use A4 layout if your audience prints the report or if your branding demands standard document dimensions.
🔦 Highlight charts by filter
What it does
When a page or a component has a filter applied (for example, group or chart filters, or controls), users can now easily identify which components are influenced by that filter with the new Applied filters panel.
How to enable
- In View mode, open the Applied Filters panel at the top-right (in the 3 dots vertical menu).
- Toggle the setting Advanced view
Important to know
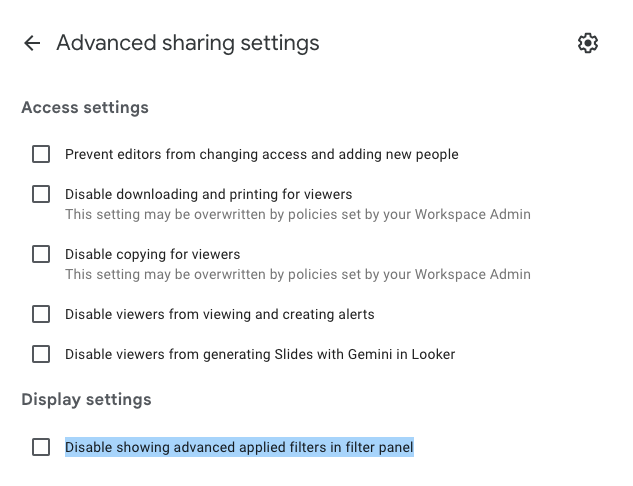
By default, this is only available for report editors. If you want viewers to see the Applied filters panel, the report editor must disable the option “Disable showing advanced applied filters in filter panel.” You’ll find this setting under Share → Advanced settings (settings toggle).
📝 Add descriptions to reports
What it is
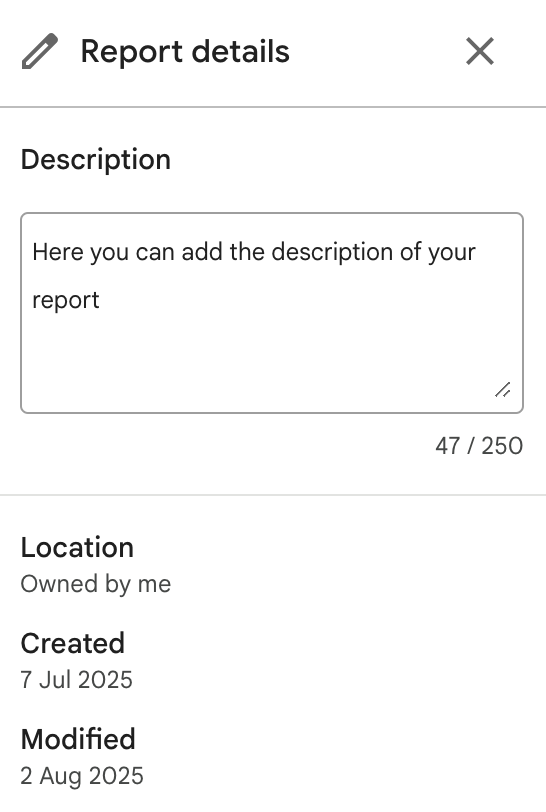
You can now include an accessible description field for each report, ideal for explaining the report’s purpose, data context, update frequency, or audience guidance. It supports better context and collaboration.
How to add a description
- Click on the 3 dots menu at the top right
- Open Report Details
- Enter your text in the Description field
Descriptions are especially valuable for enterprise reports or shared dashboards to clarify what viewers are seeing.
🛠️ Putting it all together: Example workflow
Step 1: Choose your canvas size
Decide if your dashboard will be printed or embedded in documents. If yes, select A4 portrait or landscape. Otherwise, Screen 16:9 remains ideal for digital viewing.
Step 2: Add a description
Go to report details and write a few sentences explaining:
- Data covered
- Purpose (e.g., “This report compares monthly sales by product category across regions.”)
- Update cadence or version
Step 3: Add several charts with filters
Create multiple visuals (e.g. revenue, quant, campaigns) and add filters like Region or Category controls.
Step 4: Enable highlight charts by filter
Preview the report in View mode, go to View applied filters, and easily identify what filters are applied on your page and components.
💡 Why these features matter
- Selectable A4 canvas sizes standardise exports and embed compatibility (useful in printed or PDF) driven reporting environments.
- Highlight by filter improves usability in interactive dashboards, making it obvious which visuals are influenced by current filters.
- Report descriptions enhance accessibility and storytelling by framing the analysis and giving viewers context.
These July 2025 releases align with trends in professional dashboard design and accessibility, helping your reports feel polished, user‑friendly, and purposeful.
❓July 2025 releases in Looker Studio FAQs
-
Can I revert a report back from A4 size?
Yes, you can switch canvas presets at any time, including back to Screen or US Letter, via Theme & layout.
-
Do descriptions appear to viewers?
Yes, when someone opens the report, they can view the description in report details.
-
Can I apply “highlight charts by filter” only to selected filters?
No, the highlight setting applies universally to all filters active on the page.
-
Are these features available on free version only?
No, all users of Looker Studio (free or Pro) have access. The Code Interpreter preview feature released the same month, by contrast, is limited to Loooker Studio Pro only.
✅ Final thoughts
The July 2025 releases in Looker Studio give dashboard creators stronger layout control, better user experience, and improved accessibility. Whether you’re designing for print, guiding non-technical stakeholders, or building interactive dashboards that speak for themselves, these updates are worth adopting.


